Semiconductors vs Connectors
Semiconductors End
Growth Streak in June 2011
Semiconductors came out of the 2008/2009 downturn in November, 2009 which started a growth streak of 19 consecutive months of year over year increases in monthly sales. That ended in June, 2011 when sales declined -0.5%.
The first half of 2011 resulted in good growth for both semiconductors and connectors. Semiconductors were up +6.0% on a year over year comparison and connectors were up +10.3%.
However, as clearly shown in the following graph, the growth rate of both components has slowed considerably.
Sales Performance: Connectors and Semiconductors
Year-Over-Year Change in Sales![]()
Source: Semiconductor Industry Association (SIA)
Note: All semiconductor data is three month moving average
The SIA forecasts full year sales to grow +5.4%. Bishop & Associates forecasts full year connector growth of +8.5%.
The following graph displays the last year and a half change in sales on a quarterly basis:
Semiconductors vs Connectors
YOY Percentage Change
Source: SIA
Connector demand historically moves in the same direction as semiconductors. The 2Q11 drop in semiconductor demand (growth of only +1.4%) probably means connector sales in 3Q11 will be flat on a year-over-year basis.
For sure the drop in semiconductors demand does not bode well for the second half of 2011. The issue, as always, is this a temporary slowdown or the beginning of a second dip recession?
Regional Analysis
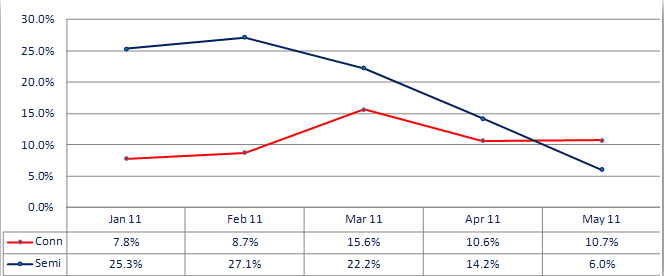
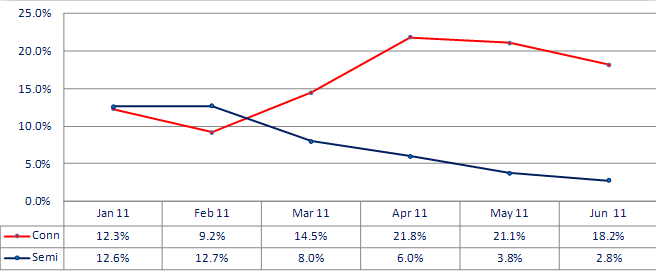
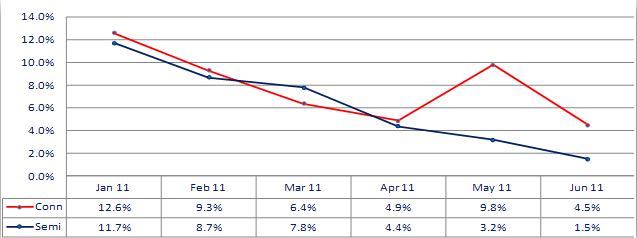
The following graphs plot year-over-year monthly change in sales by geographic region since January 2011.
- North America is now growing in the low single digits.
- European connector sales are still growing double digits while semiconductors are low single digits.
- Japan sales have declined to negative growth starting in March for semiconductors and April for connectors.
- Asia (includes China) is worrisome. Both semiconductors and connectors are achieving low single digit growth. For the past decade, the electronic industry growth has been mostly fueled by this region.
North America
Year-Over-Year Change in Sales 
Source: SIA
Europe
Year-Over-Year Change in Sales 
Source: SIA
Japan
Year-Over-Year Change in Sales 
Source: SIA
Asia Pacific
Year-Over-Year Change in Sales 
Source: SIA